Introduction
When I first started posting on social media platforms, I thought basic metrics like likes, shares, and comments were all that mattered. But after a few months, I discovered a whole new world of social media insights — and it completely transformed my content strategy.
In this article, I’ll break down 10 key social media metrics you need to track, making it easier for you to start monitoring your social media performance and achieve real success.
So, before we dive in, let’s get into basics!
What are social media metrics?
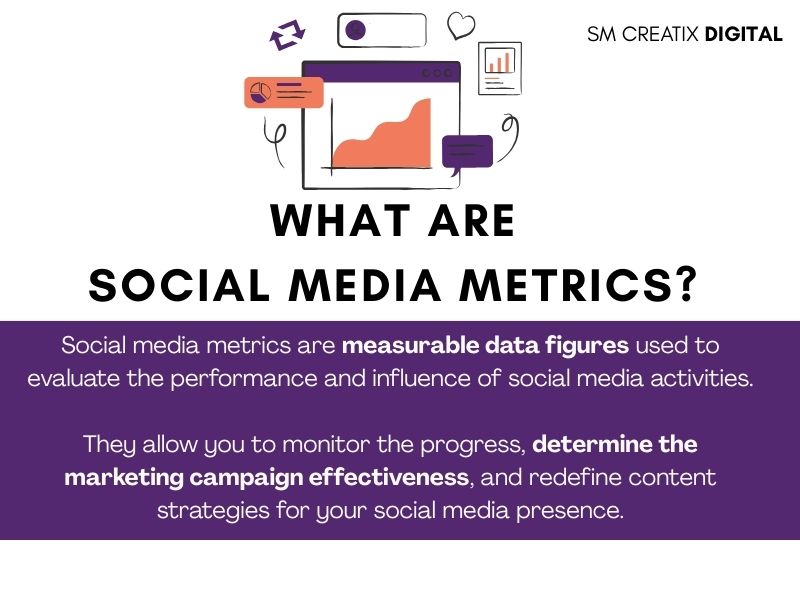
Social media metrics are measurable data figures used to track the performance and influence of social media activities. They include a variety of components like engagement metrics, reach & impression metrics, follower growth, click-through rates and more.
These metrics offer valuable insights into audience behaviour and content performance, enabling you to redefine content strategies that resonate with your audience and identify their most active times across platforms. This, in turn, empowers business owners and marketers to make data-driven decisions based on latest social media analytics reports.
Why are social media metrics important?
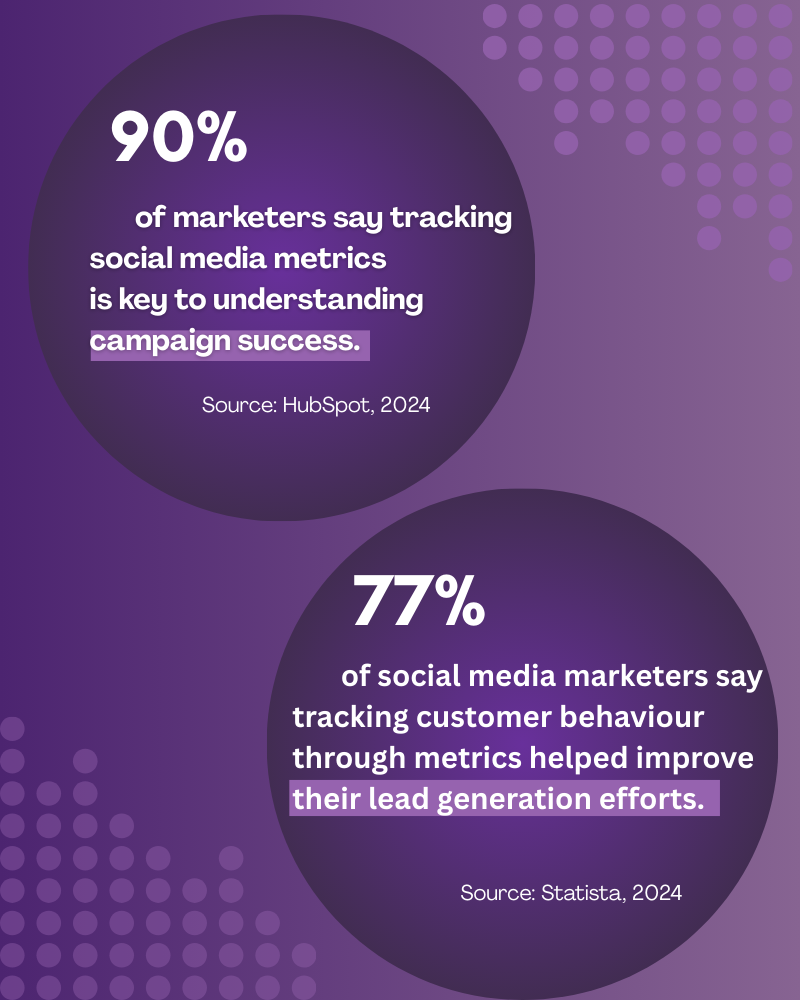
Social media marketing is the fastest growing market, dominating the digital platforms with ad spend expected to reach 276.72 billion US dollars in 2025. This future trend represents that more and more companies have started to focus on growing their brand visibility through social media advertising. Therefore, businesses must track their social media metrics, especially when managing multiple marketing campaigns, optimising content strategies, and ensuring high ROI investments, through data-driven decision-making.
But why is this even more important? Tracking social media performance indicators allows you to build authentic connections with your audience, monitor audience insights (engagement metrics and follower demographics) and optimise an effective content marketing strategy. If your goal is to grow organically on social media, it’s important to be patient and allow your organic efforts to establish a strong brand presence.
So, whether you aim for paid ads or organic social media efforts, tracking social media metrics is the key to success!
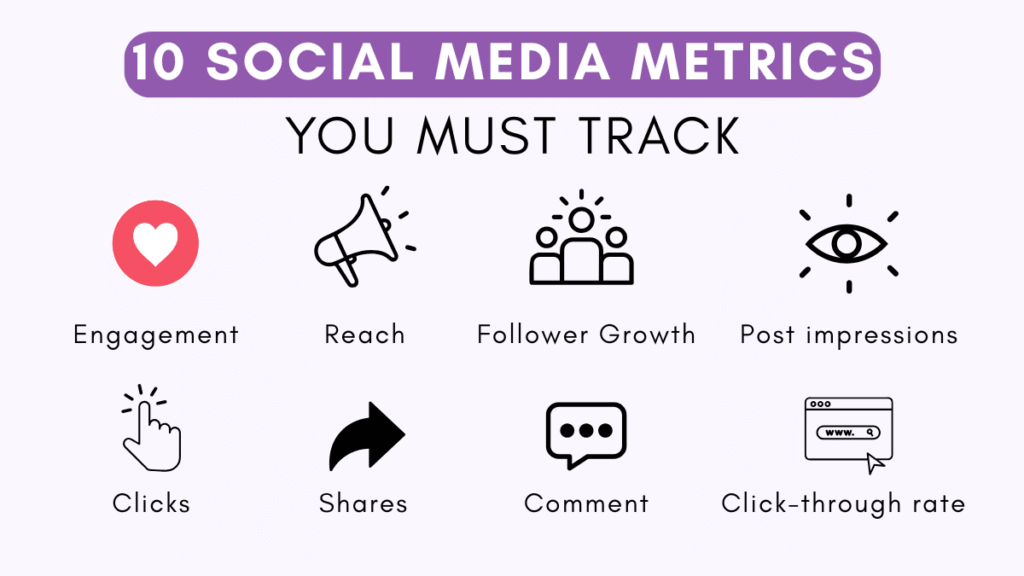
10 Essential Social Media Metrics You Must Track
After inspecting the importance of social media metrics, let’s look at the top 10 social media metrics you must track.
1. Engagement Rate

The social media engagement rate calculates how well a brand’s audience connects with its content, through actions such as (likes, comments & shares). It is calculated by dividing the total number of followers or people who saw the content (reach). Plus, a good user engagement score differs by each platform and industry; an engagement rate higher than 1 per cent is considered substantial, and measures above 3 per cent indicate a robust engagement rate.
2. Reach
Social media reach refers to the volume of unique users who view your content. It depends on factors such as the follower base, subscribers, interactions, and overall brand visibility percentage. According to a research by Hootsuite, on average, over 5.2 per cent of a page’s followers view a post organically; in other words, if your page had over 1000 followers, about 52 of them would view your post without paid ads. This highlights the importance of social media reach as it allows you to gauge the overall size of your audience for each post. Further, it reflects how effectively your content connects with a broader audience, as social media algorithms largely influence reach.
3. Impressions
Impressions indicate the total number of times your content is exposed, despite engagement metrics. This can signal how much the content is being seen by social media users. But every digital platform has its ways of measuring reach and impressions. For instance, TikTok’s & YouTube’s “total video views” are the same as impressions.
4. Follower Growth
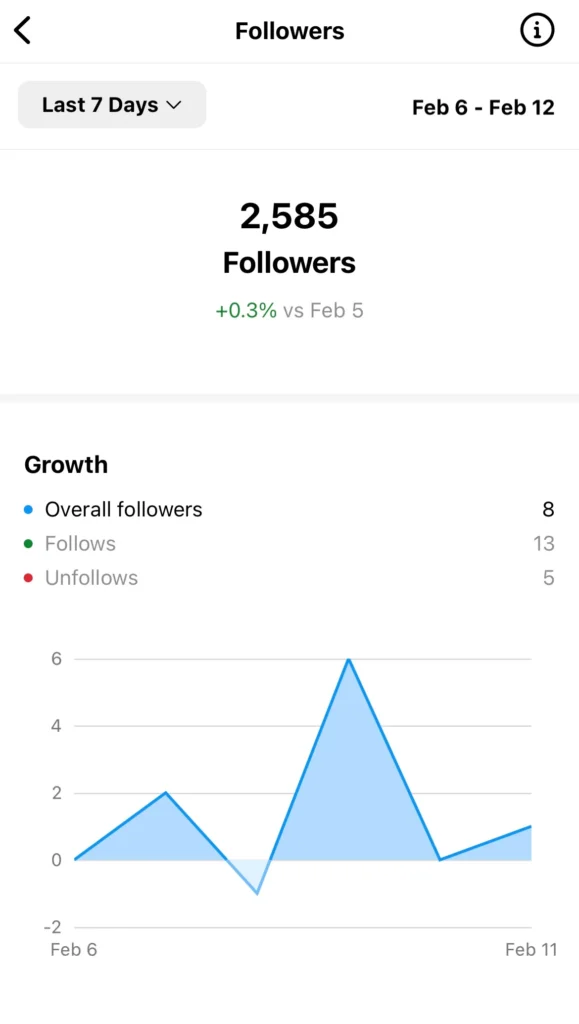
Follower growth allows you to track the rise and drop of your followers over time. This can signify the effectiveness of content strategy in captivating new audiences. Preferably, it’s better to keep trsoack of your follower growth rate as it means reaching new target audiences. While it’s better to have a collaborative audience group that interacts with your posts through comments or your Instagram stories than having inactive followers.
5. Audience demographics
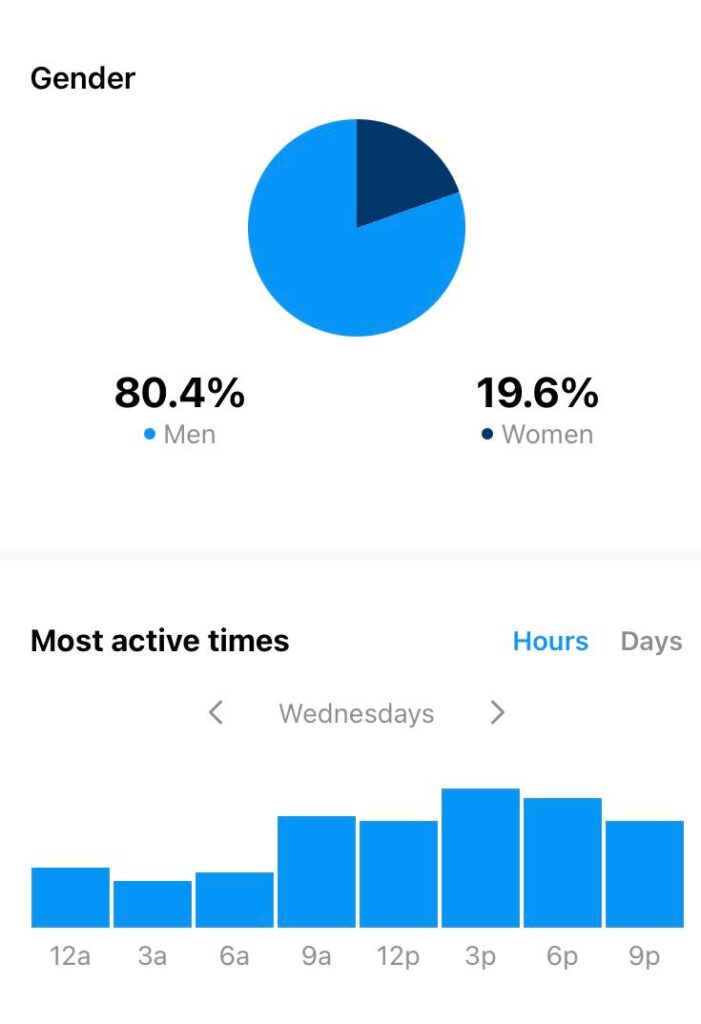
Audience demographics from your social media insights are an essential tool for tracking customer behaviour. These insights provide valuable demographic and geographic data about your followers, enabling you to tailor your content strategy effectively. Once you identify your target audience, you can refine your social media campaigns accordingly.
For example, if you’re selling streetwear shirts online, your ads could be designed to appeal to customer segments such as teenagers and young adults aged 20–25, targeting all genders. However, if after a week of posting, you notice no increase in sales, sign-ups, or click-through rates, it may indicate that you’re reaching the wrong audience. In such cases, it’s important to re-evaluate your targeting strategy based on updated insights.
6. Bounce Rate
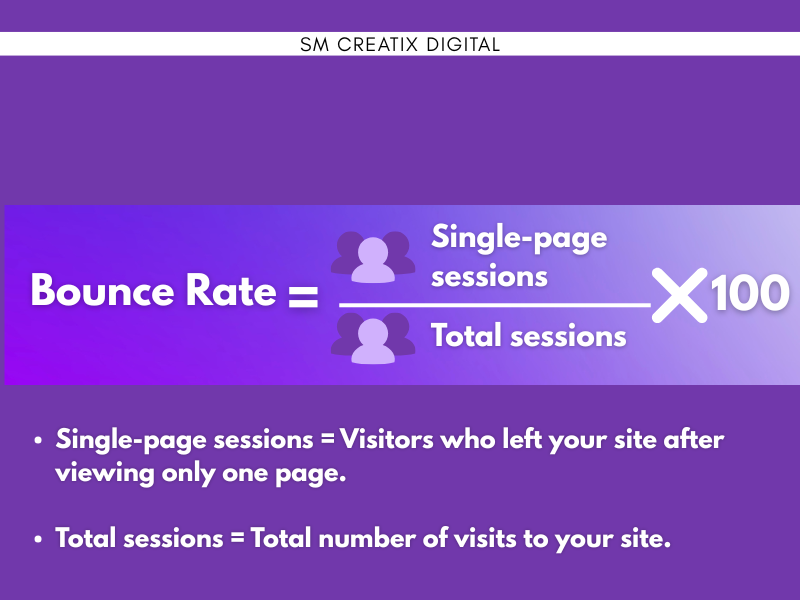
Bounce rate is the proportion of visitors who guide away from your site after viewing only one page. Although this isn’t a social media metric per se, it should still be tracked as your social media campaign will often link to your web pages. According to Fullstory, a bounce rate of 40 per cent or lower is considered good, while anything above 55 per cent might show a need for development.
You can visualise this as someone observing your initial web page and then moving to another site. This is insightful data and can suggest the importance and quality of your landing page content. If people are simply clicking and going away, you might need to reevaluate your current scheme.
7. Video reach and engagement
Across social networks, video metrics are somewhat all-inclusive as they are getting more developed with every app upgrade. Based on each social media algorithm, you can track metrics like
- Number of replays
- Total number of views
- Total playback time
- Demographics and the area of the audience reached
- Traffic source
- Average viewing time
Granular data points like these can enable you to test different video formats and storytelling methods.
Comments are closed